 Originally Posted by: crikey  Thanks KEN. The nuts and bolts of models is something l know nothing about. So l totally accept what you say.
As l know this is one of your areas of expertise.
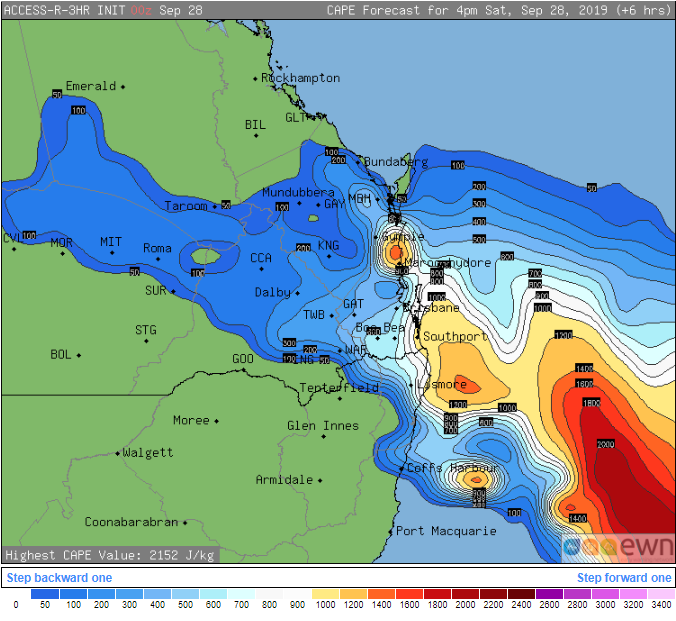
What l do look out for being a pattern observer is why GFS CAPE spatial pattern was spot on regarding position of activity, whereas ACC r was off the mark? Most other times it is spot on in positioning generally and so l look for answers.
Matching ACC against stormcast CAPE is something l have never done before and so the investigation begins GFS CAPE is usually close to the mark when it comes to typical surface-based thunderstorm areas because of the way CAPE is handled by the model. But there are notable exceptions. For example, it'll often show extreme values off the northwest coast of Australia during the build-up season as well as parts of the tropics even though little to no thunderstorm activity ends up occurring. This is because by default, the CAPE fields displayed on Stormcast is surface based CAPE i.e. CAPE calculated from a parcel that's assumed to rise from the surface and therefore possess the GFS surface forecast temp and dewpoint for that point. In these setups, there's only a very shallow layer of good moisture near the surface which means GFS forecasts those parcels to condense at a low height then cool at the saturated adiabatic lapse rate as it rises further (it stays warmer than the surrounding air and therefore gives rise to unrealistically extreme CAPE values). But on typical hot sunny days, parcels rise from a mixed layer thousands of feet deep in the lower levels so they don't have the same high temp or dewpoint as parcels rising from the surface, and therefore their true CAPE or instability is lower. Conversely, GFS surface based CAPE often tends to show very low or even non-existent values for dry inland storms even though it results in lots of lightning - this is because convection is helped by a layer of moisture aloft rather than the surface where the surface based CAPE values represent. This is why there's different types of CAPE that are looked at by forecasters such as mixed layer CAPE in the lowest X hpa of the atmosphere, most unstable (MU) CAPE which uses parcels rising from a level that yields the most CAPE, effective layer CAPE which uses parcels rising from a level where parcels are likely to start rising freely on their own from, etc. Above is the ACCESS-R CAPE for 4pm yesterday based on its 00z run. I'm allowed to post this particular version. And the preceding image is the detected lightning within the 24hrs after 8am Saturday. As you can see, the general area is reasonably well represented by the storms that ended up occurring although note the low values inland which is typical of inland low-rainfall storms because convection is encouraged by moisture aloft.
|


|
|
Font Color
Font Size
|
|
Important Information:
The Weather Forum uses cookies. By continuing to browse this site, you are agreeing to our use of cookies.
More Details
Close