Howdy Squall19,
A very good question but also a very complex question. But, lets not make it complex, I was always taught that weather should be explained in a way that everyone can understand. And the most important thing is to ask questions, lots of questions. Many feel I better not ask because I will feel like I don't know anything and people will laugh at me, in saying that, you never stop learning and you or someone may ask or challenge a concept that makes everyone stop and think and dig deeper for an answer and before you know it, everyone has learnt something new. No one has all the answers, in every field of life people discover something new.
So the question is, "If you want to find out if storms will develop in Adelaide this Friday morning, the 19th September 2019. Along the cold front."
There are so many things at play, for example the Lifted Index (Li's) What is a lifted Index, it is the temperature difference between the environment Te(p) and an air parcel lifted adiabatically Tp(p) at a given pressure height in the troposphere (lowest layer where most weather occurs) of the atmosphere, usually 500 hPa (mb). The temperature is measured in Celsius. WHAT???? pretty full on.
So lets make that easy to understand. What is a lifted Index?
The Lifted Index is a measure of the atmosphere's stability (or instability) and is used to determine the thunderstorm potential. Parcels of warmer air may start to rise if they are warmer than surrounding air, and this is called Convection. This Parcel of air will continue to rise from the ground and when it reaches a height of Approx. 5500M (the 500MB on charts) the temperature of that Parcel is subtracted from the temperature of the atmosphere at 500MB. When that figure shows a higher negative value it means it will continue to rise.
So why is that important to look for? Thunderstorms are fueled by strong rising air, thus the Lifted Index is a good measurement of the atmosphere's potential to produce severe thunderstorms.
BUT, If the Lifted Index is favorable for severe storms but other conditions are not met, then no storms may form at all.
So there are many other things to look at, for example you have Cape, Sheer, Caps, TT's etc and most importantly moisture. These can all be found on the Soundings/SkewT's.
So to go back to the original question and for today, will go the real easy way.
Personally I go to
http://forecasts.bsch.com.au/stormcast.html then Select SA or even Adelaide. Running through the LI's and nothing is really jumping out at me from Thursday afternoon (figures at end of post) and throughout the day for Friday. Figure 1 at 09:30 you will see there is no LI's for Adelaide but you will notice in Victoria there is some LI's
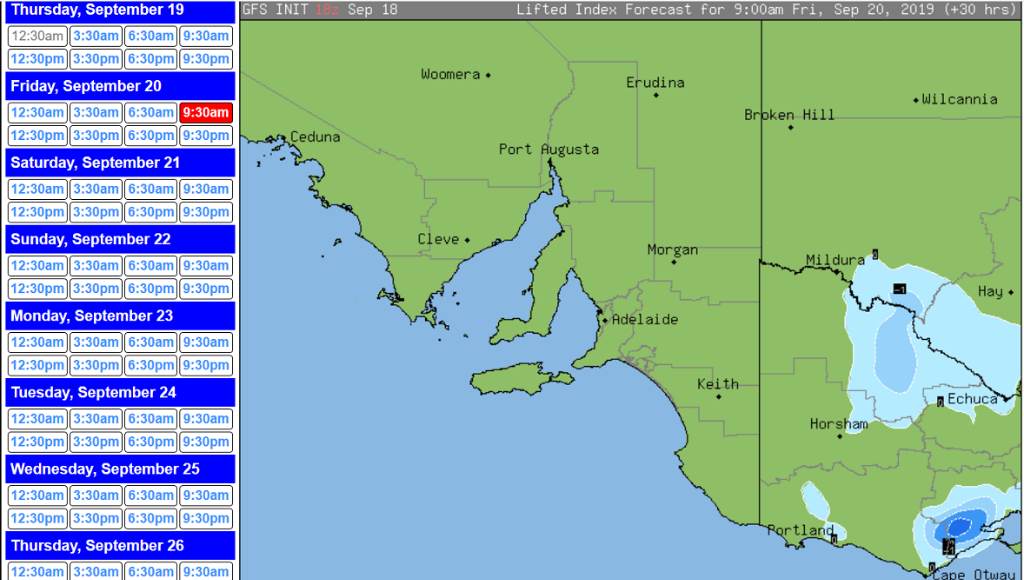
In figure 2. you will notice the increase in the negative LI'S in Victoria compared to SA

The next is the Cape.
Convective Available Potential Energy (CAPE) is measure of the amount of energy available for convection. CAPE is directly related to the maximum potential vertical speed within an updraft; thus, higher values indicate greater potential for severe weather.
Figure 1 There is some very small value in Cape and most of it is offshore

Figure 2 Notice very small values in the Cape compared to Victoria

So for me it is not looking good for a TS just looking at those two ingredients. There is sheer and there is plenty of moisture that is eveident on the sounding.
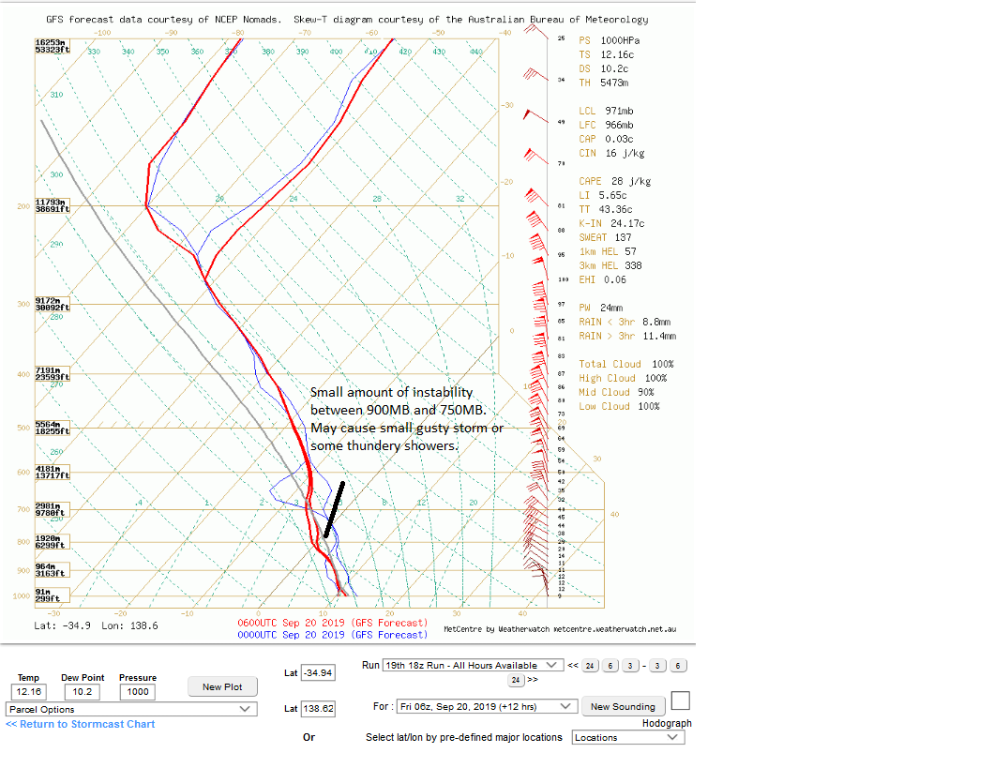
Therefore looking at the forecast Sounding produced from the models information it just does not look good for a TS. Understanding Soundings is a whole lesson on its own but I will paste it anyway. Sounding at 09:30. ( The soundings we are really wanting to see are the ones released around Australia and we usually will receive that data around 11:00.

And Sounding at 1530 there is a small amount of instability which may produce a chance of a gusty storm or thundery showers. Very slight chance.
So that is a simple way. I also had a look at EC and it was much the same. It showed storm activity out to sea.
There is a lot in predicting storms so hopefully this is just a starting point. I am not sure at what point you are at in predicting storms but it is just a starting point using the basics.Hopefully others will join in and questions asked and we can keep building this thread.
The only other thing was this afternoon at 15:30 but as you will see the sounding is not looking good


So it looks like a cold windy day with maybe a rumble or 2 for Adelaide.
Cheers
Colin