Weather Forum
»
General Weather Chat
»
General Chat About Anything Weather Related
»
Thunderstorm formation and structure, thunderstorm forecasting, SKEW-T diagrams
Rank: Member
Groups: Registered
Joined: 18/09/2019(UTC) Posts: 15  Location: Adelaide Thanks: 57 times
Was thanked: 30 time(s) in 13 post(s)
|
Thanks colmait and others contributing here. Looks like l have some reading to do. Thanks for the link to the SEQ storm event as well. There is nothing better than seeing how a forecast pans out. I have come to realize that becoming a storm analyst is not a short course. It is a specialist area that takes many years of experience. So l take my hat off to the experienced storm forecaster. I will learn but it will be slowly. 
|
 3 users thanked squall19 for this useful post.
|
|
|
|
Rank: Advanced Member
Groups: Registered, Administrators Joined: 21/08/2019(UTC) Posts: 941 Location: Brisbane Northside Thanks: 1198 times
Was thanked: 1136 time(s) in 674 post(s)
|
Originally Posted by: squall19  Thanks colmait and others contributing here. Looks like l have some reading to do. Thanks for the link to the SEQ storm event as well. There is nothing better than seeing how a forecast pans out. I have come to realize that becoming a storm analyst is not a short course. It is a specialist area that takes many years of experience. So l take my hat off to the experienced storm forecaster. I will learn but it will be slowly. Hi squall19, I think you will pick it up easily and pretty quick. The 1st part of the sounding is a bit of a blah blah but it is important to know what those different lines are. They were the very basic terms, otherwise if I posted the full on explanation the post was really massive and sort of got bogged down. The next part is where soundings gets fun and really interesting. The main thing is never feel embarrassed at trying and learn from the mistakes if it goes wrong. BoM get it wrong. The best chasers in the US and in Australia get it wrong. The atmosphere changes every second. No storms are ever the same. We just have to make it fun and we are all on the same playing field and on the same team.  [ Cheers. |
Colin Maitland. |
3 users thanked Colmait for this useful post.
|
|
|
|
Rank: Advanced Member
Groups: Registered
Joined: 24/08/2019(UTC) Posts: 292 Location: Country Victorian Thanks: 580 times
Was thanked: 503 time(s) in 194 post(s)
|
A discussion regarding CAPE l have extracted
Thanks to KEN for his explanation 
https://www.weatherforum...Sep---2nd-Oct-2019/page7
quote
'GFS CAPE is usually close to the mark when it comes to typical surface-based thunderstorm areas because of the way CAPE is handled by the model. But there are notable exceptions. For example, it'll often show extreme values off the northwest coast of Australia during the build-up season as well as parts of the tropics even though little to no thunderstorm activity ends up occurring. This is because by default, the CAPE fields displayed on Stormcast is surface based CAPE i.e. CAPE calculated from a parcel that's assumed to rise from the surface and therefore possess the GFS surface forecast temp and dewpoint for that point. In these setups, there's only a very shallow layer of good moisture near the surface which means GFS forecasts those parcels to condense at a low height then cool at the saturated adiabatic lapse rate as it rises further (it stays warmer than the surrounding air and therefore gives rise to unrealistically extreme CAPE values). But on typical hot sunny days, parcels rise from a mixed layer thousands of feet deep in the lower levels so they don't have the same high temp or dewpoint as parcels rising from the surface, and therefore their true CAPE or instability is lower.
Conversely, GFS surface based CAPE often tends to show very low or even non-existent values for dry inland storms even though it results in lots of lightning - this is because convection is helped by a layer of moisture aloft rather than the surface where the surface based CAPE values represent.
This is why there's different types of CAPE that are looked at by forecasters such as mixed layer CAPE in the lowest X hpa of the atmosphere, most unstable (MU) CAPE which uses parcels rising from a level that yields the most CAPE, effective layer CAPE which uses parcels rising from a level where parcels are likely to start rising freely on their own from, etc.....'
|
1 user thanked crikey for this useful post.
|
|
|
|
Rank: Advanced Member
Groups: Registered
Joined: 21/09/2019(UTC) Posts: 32 Location: Gold coast Thanks: 125 times
Was thanked: 126 time(s) in 31 post(s)
|
|
2 users thanked juztchillin for this useful post.
|
|
|
|
Rank: Advanced Member
Groups: Registered, Administrators Joined: 21/08/2019(UTC) Posts: 941 Location: Brisbane Northside Thanks: 1198 times
Was thanked: 1136 time(s) in 674 post(s)
|
Sounding part B 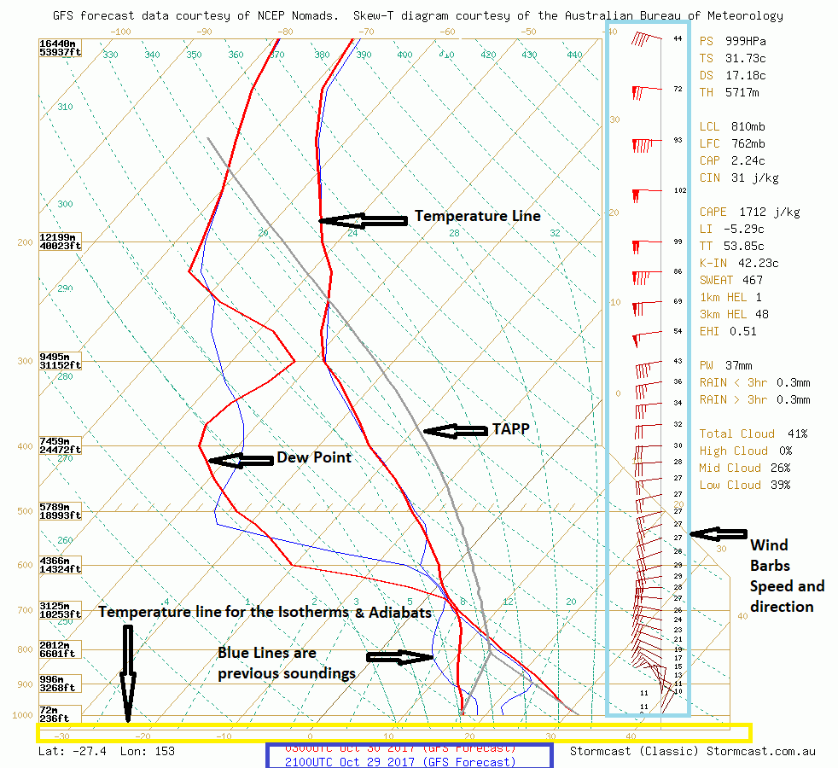 Once the weather Balloon has been released and all the data has been analyzed this is the what a sounding may look like depending on the day and time it is released. As you can see there are two red lines, one on the left of the sounding and one on the right both rising from 1000mb. The left had side is the Dew Point and the Right hand side is the Temperature The Blue Lines that you can see are from a previous run anywhere from 12 -24 hours earlier as a rough guide. The Blue box at the bottom of the sounding is the time of the sounding in UTC time. The Red time is the new sounding and the blue time is the previous sounding. The grey line is The TAPP, the Theoretical Air Parcel Plot (TAPP) and it is a representation of how a parcel of air may rise from near the surface. Where the grey line is to the right of the temperature trace it is unstable. The further to the right of the Temperature line indicates greater instability. And if TAPP line is to the left of the temp trace then things are relatively stable. You will also notice on the base of the graph, the yellow box is the temperatures. These relate to the Isotherm lines,the Dry Adiabats and the Moist Adiabats. The Red rising temperature, the Red Dew Point etc. They start at negative values on the left hand side of 0° and positive values on the right hand side. They increase or decrease by 10°increments. The other highlighted section is the wind barbs. On the right hand side of the Skew-T, you will see flags along the side at different levels. This tells you the wind direction and strength at that level. The part of the flag with the barbs points to the direction the wind is coming from. An example can be found in the diagram of the direction.  Below is a table showing the different speeds shown on Wind Barbs  Please feel free to add your own input or question. I am continuing to work on part C. Edited by user Wednesday, 2 October 2019 12:37:27 PM(UTC)
| Reason: just editing. Time poor. |
Colin Maitland. |
2 users thanked Colmait for this useful post.
|
|
|
|
Weather Forum
»
General Weather Chat
»
General Chat About Anything Weather Related
»
Thunderstorm formation and structure, thunderstorm forecasting, SKEW-T diagrams
Forum Jump
You cannot post new topics in this forum.
You cannot reply to topics in this forum.
You cannot delete your posts in this forum.
You cannot edit your posts in this forum.
You cannot create polls in this forum.
You cannot vote in polls in this forum.
Important Information:
The Weather Forum uses cookies. By continuing to browse this site, you are agreeing to our use of cookies.
More Details
Close